

Peak demand charges are one of the highest and least understood costs on commercial electricity bills. This article explains how 15-minute usage spikes drive up monthly costs and how real-time demand management reduces avoidable peaks without disrupting operations.
Check your last electricity bill and find the demand charge line item. That number was not determined by how hard your building worked last month. In many cases, it was locked in during a single 15-minute window you probably never saw coming.
That’s how demand charges work. Utilities bill commercial buildings not only for total electricity consumption, but also for the highest kilowatt (kW) demand at which electricity was used during the billing period. One brief, uncoordinated surge in consumption resets your billing benchmark, and you will be stuck paying for that spike every month until the underlying behavior changes.
To put the economics in perspective, running a 100-watt bulb for 15 minutes during a peak interval can cost as much as running that same bulb for nearly 10 full days during off-peak hours – a cost ratio that can exceed 900 to 1 in high-tariff regions. The math feels wrong until you understand the mechanics, and once you do, the case for active demand management becomes difficult to ignore.
Most buildings operate with zero real-time visibility into when those spikes occur or what causes them, so the problem is not just how much electricity a building uses; it is that the most expensive moments tend to go unnoticed until the bill arrives.
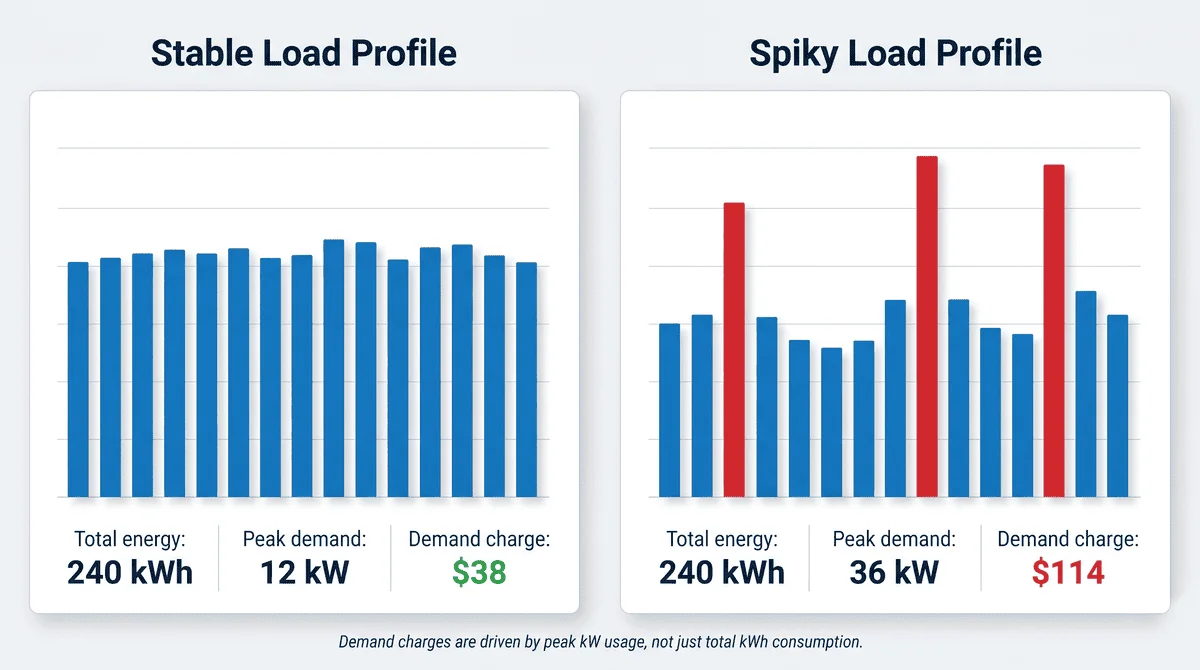
Most facilities track electricity consumption in kilowatt-hours (kWh), which measures total energy used over time. Demand charges are based on something different: the highest rate of electricity use during a short interval, typically 15 minutes, measured in kilowatts (kW). This distinction matters because utilities are putting a pricing strain on the grid, not just overall consumption. A facility that maintains relatively stable usage may pay less than one with the same monthly consumption but sharper demand spikes.
Some tariffs make the financial impact even more persistent through ratchet clauses. These provisions establish a minimum billing floor based on the highest demand recorded over the prior 11 months. If a building records one unusually high demand event, portions of that peak can continue affecting bills for months afterward, even if usage later declines.
This is also where load factor becomes important. Load factor measures how evenly electricity is used over time. For example, a building that averages 200 kW but peaks at 800kW has a 25% load factor, meaning it pays demand charges on four times its typical usage rate. Buildings with large swings between average demand and peak demand tend to carry higher demand charges because their usage profile is less stable. Many facilities operate with low load factors without realizing how much cost exposure that creates.
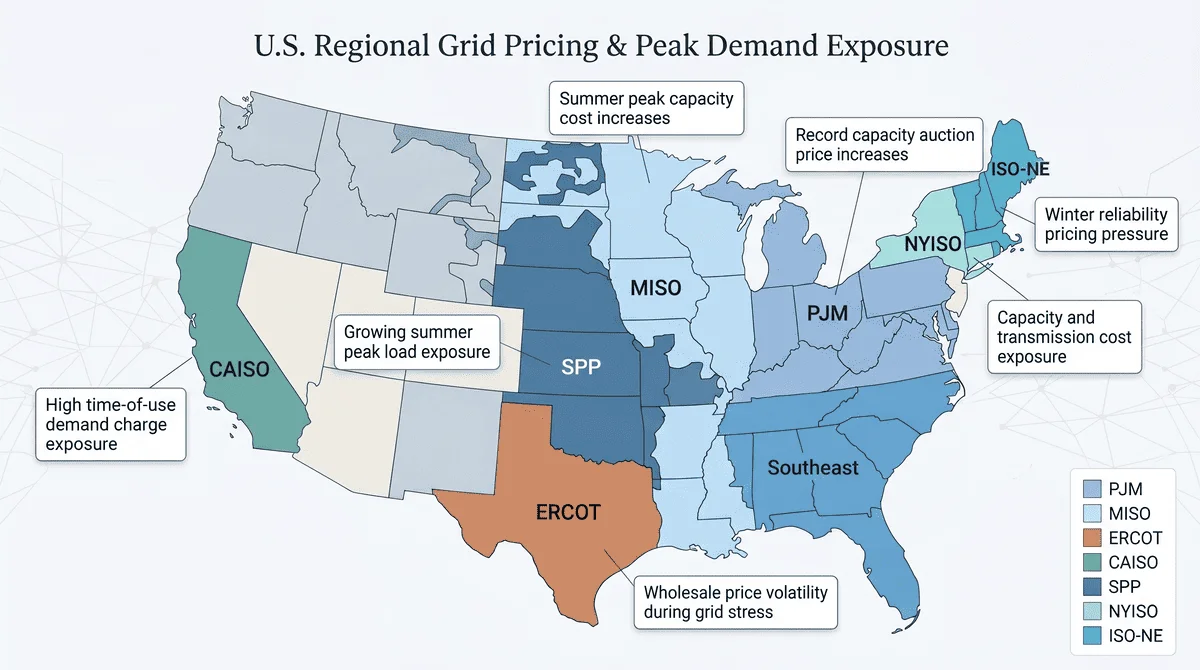
Regional grid structures amplify this exposure in different ways.
In PJM, which covers 13 different states across the Mid-Atlantic and Midwest, capacity-related charges are tied to coincident peak events across the grid. A building’s demand during a small number of high-stress summer hours can determine annual capacity costs. PJM capacity auction prices increased from $28.92/megawatt-day for the 2024/25 delivery year to $269.92/megawatt-day for 2025/26 before reaching a record $329.17/megawatt-day for 2026/27. This shift has materially increased exposure for large commercial customers whose demand aligns with system peaks.
MISO operates under a similar summer-peaking structure, where cooling loads and coincident demand events heavily influence capacity allocation and pricing. In ERCOT, the absence of a traditional capacity market creates a different kind of risk: extreme price volatility during periods of grid stress. Winter Storm Uri remains the clearest example, when wholesale electricity prices hit the market cap for days during the event.
California presents another version of the problem. Commercial demand rates under utilities such as PG&E and SDG&E commonly range from roughly $15 to over $40 per kW, depending on tariff structure and time-of-use windows. Under those rates, a 200-kW demand spike can add several thousand dollars to a monthly bill, while larger facilities can see five-figure exposure from recurring peaks alone.
Most spikes are not caused by one catastrophic event. They are usually the result of systems operating without coordination: simultaneous HVAC startup across zones, overlapping equipment schedules, lighting and plug load overlap, or manual overrides that push multiple systems online at once. Platforms like E360 track interval-level demand across all major grid regions, including PJM, ERCOT, and CAISO, giving operators the visibility needed to act before peaks are recorded.
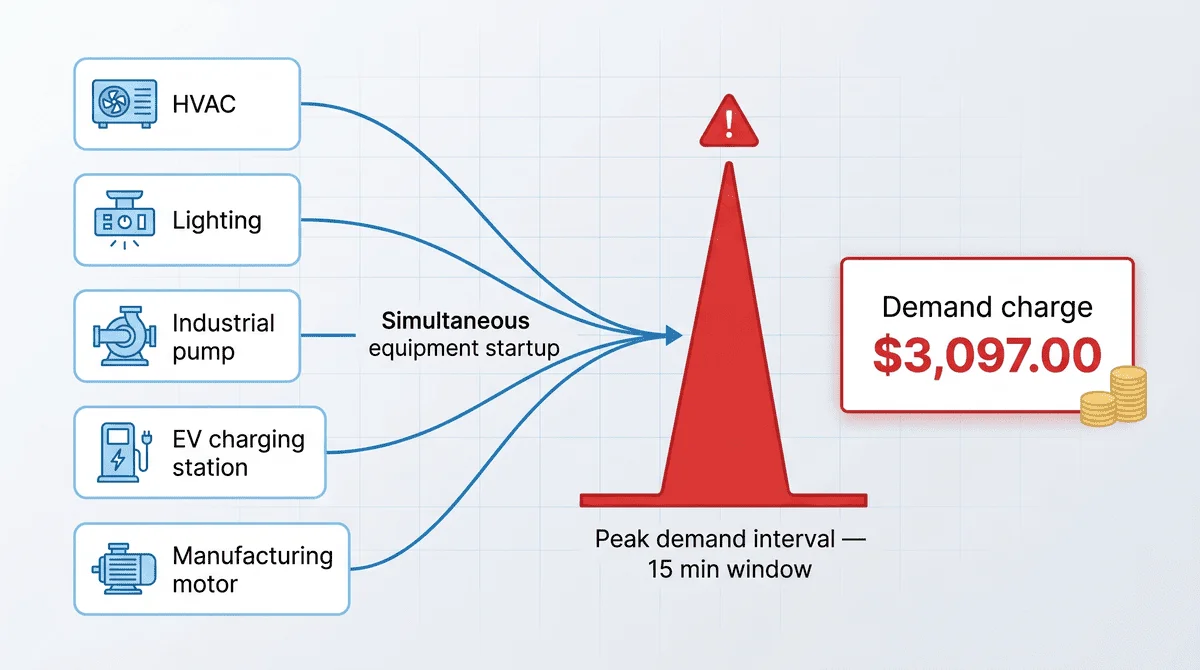
For facility managers, energy managers, CFOs, and building owners, demand charges create a difficult problem because the cost is operationally driven but financially visible only after the billing cycle closes.
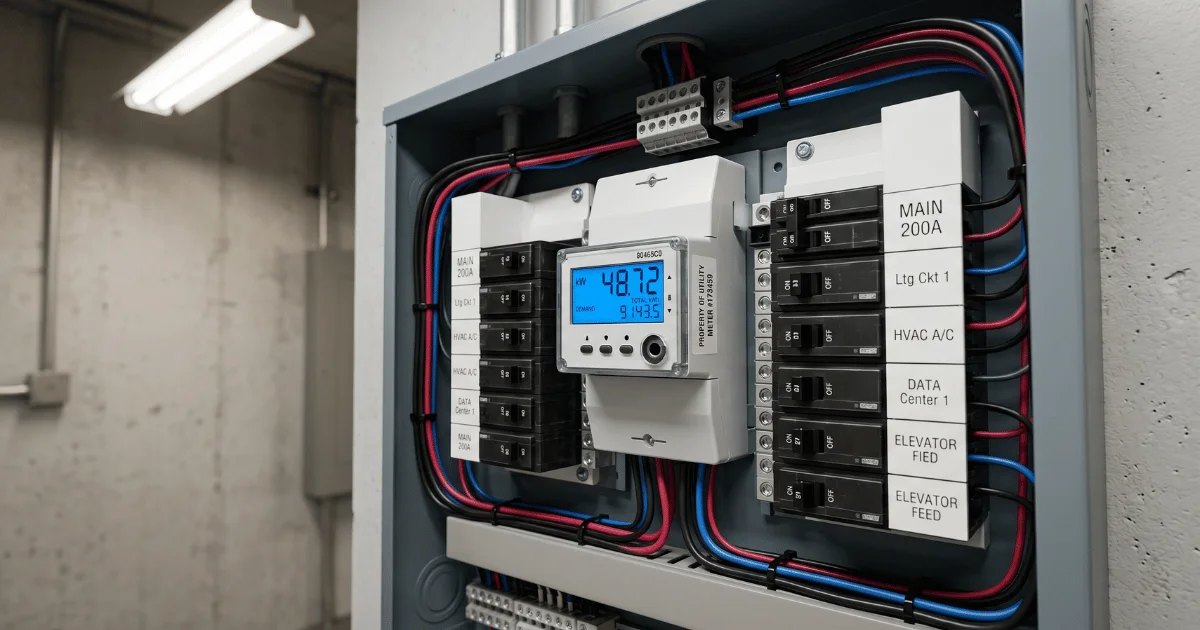
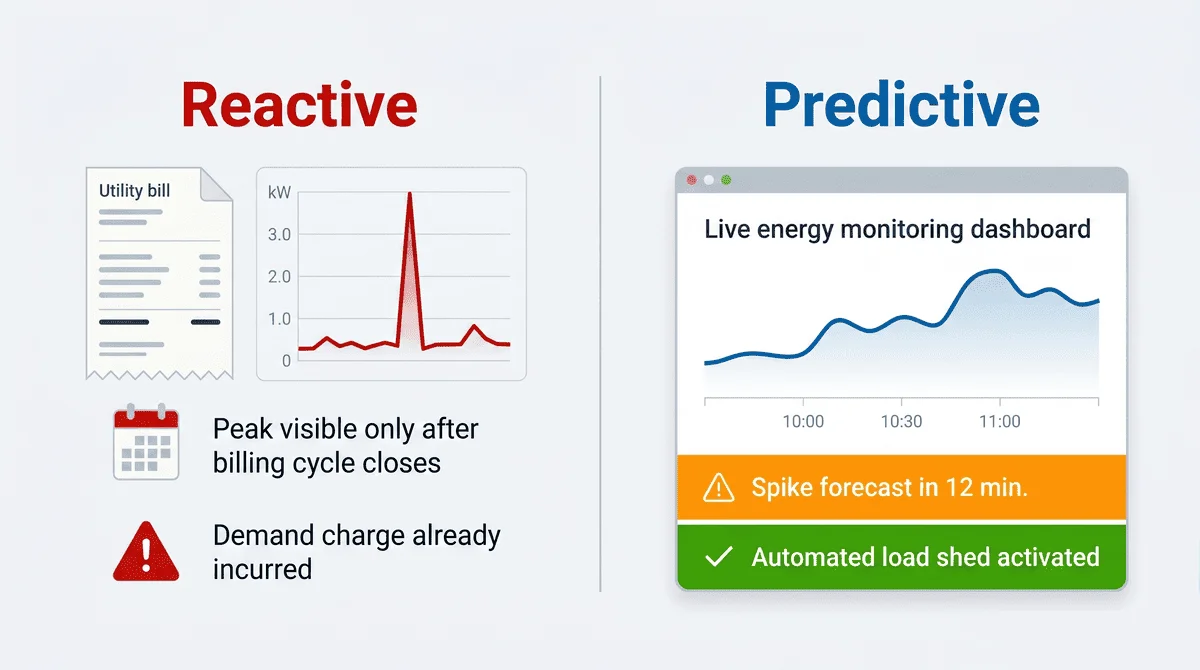
By the time a utility bill arrives, the peak event has already happened. Reconstructing what caused a specific 15-minute spike often means piecing together data from separate systems: building management systems, submeters, scheduling platforms, and spreadsheets that were never designed to work together in real time.
That disconnect creates both operational and financial risk. Buildings may appear efficient from a total consumption standpoint while still carrying substantial demand-driven costs. For owners and finance teams, that translates into unpredictable operating expenses and pressure on NOI. For facility and energy managers, it creates a situation where one of the largest controllable line items is also one of the hardest to actively manage.
The challenge is becoming more significant as peak demand continues to rise across the grid. U.S. electricity demand is projected to increase substantially through 2035. In PJM alone, forecasted peak load for 2026/27 increased by more than 5,400 megawatts year-over-year.
As utilities place greater emphasis on peak capacity and grid reliability, demand-related charges are expected to represent a larger share of commercial electricity costs. Without interval-level visibility into demand behavior, more of that exposure remains outside active operational control.
Reducing demand charges is not necessarily about reducing total energy use. In many cases, it is about controlling when energy is used and preventing avoidable spikes from occurring in the first place.
Utility bills confirm that a peak occurred, but they do not explain which systems contributed to it, when the spike developed, or whether it could have been avoided. That level of diagnosis requires real-time or near-real-time monitoring across building systems. Once those patterns become visible, the operational adjustments are often straightforward.
One frequently overlooked contributor is power factor. A power factor below approximately 0.95 means the facility is drawing more current than necessary for its actual work output, which some utilities penalize with additional charges. Standard energy tracking rarely surfaces this, but implementing interval-level monitoring can help.
Morning startup periods are a common example. A facility may bring HVAC systems, lighting, pumps, and production equipment online simultaneously, creating a temporary surge that sets the monthly demand benchmark. Staggering those systems across even a short window of time can materially reduce the peak without affecting occupant comfort or core operations.
Other common demand reduction strategies include:
None of these changes necessarily requires infrastructure upgrades. In many cases, they require coordination and a system capable of automatically executing and verifying that coordination.
Forecasting changes the equation. Traditional demand response programs are reactive and utility-triggered. Forecasting allows operators to identify rising demand before a billing interval closes and intervene before the peak is recorded.
This is where demand charge management platforms and energy management systems (EMS) become operationally valuable. EMS like E360 provide real-time visibility into load behavior, identify rising demand trajectories, and create a coordination layer across building systems so operators can respond before a short spike becomes a recurring monthly cost.
The broader direction of utility pricing is clear: peak demand is becoming more financially important. Across PJM, MISO, ERCOT, CAISO, and other regional grids, utilities are placing greater emphasis on peak capacity and system reliability rather than total energy consumption alone. The cost structure is shifting from how much electricity a building uses to how and when that electricity is used.
Several structural trends are accelerating that shift:
PJM’s recent capacity auctions illustrate the pressure directly. The grid has now recorded multiple consecutive years of record-high auction pricing while simultaneously facing capacity shortfalls against projected reliability requirements.
For commercial buildings, this means demand-related exposure is unlikely to stabilize on its own. Facilities without active demand management strategies may face increasing cost volatility as peak-sensitive pricing structures continue expanding across utility markets.
Demand charges are not a fixed operating cost. They are largely driven by timing, coordination, and visibility.
Facilities that actively monitor and manage peak demand behavior are often able to reduce one of the most volatile portions of their utility spend without major infrastructure upgrades. The difference is operational awareness: understanding when peaks occur, what systems are driving them, and how to intervene before those intervals become billing events. The shift from reactive utility-bill analysis to real-time demand management is increasingly becoming a financial necessity rather than an optimization exercise.
As utilities continue shifting costs toward peak demand, facilities that can see spikes forming before they happen will have a measurable financial advantage over those reacting after their bill arrives.
Subscribe to Sanalife Energy's newsletter for top industry insights, trends, and news.


We deliver innovative energy management, demand response, and building automation solutions to enterprise, manufacturing, industrial, healthcare, hospitality, K-12, and higher education sectors across the United States and globally.
©2026 InTech Energy, Inc. DBA Sanalife. All rights reserved. Various trademarks held by their respective owners.