

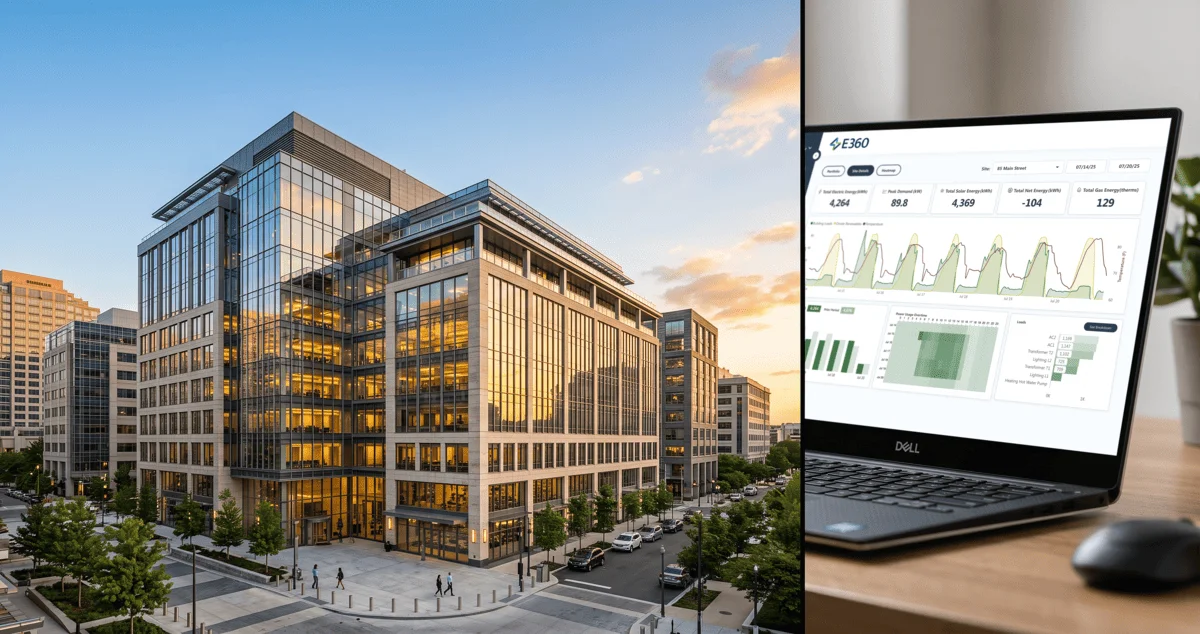
Choosing the right energy management software means cutting through a crowded EMS market. This 2026 buyer's guide covers six evaluation criteria, a ten-question vendor checklist, and realistic pricing, implementation, and ROI benchmarks for commercial buildings.
The limitations that matter most in an energy management system (EMS) rarely surface during the sales process. A platform can demo beautifully in a single, well-configured building. The problems appear six to eighteen months later: when you try to scale it across a twelve-building portfolio, when a compliance deadline requires jurisdiction-specific reporting the platform cannot generate, or when you decide to switch providers and discover that three years of historical data are locked in a proprietary format.
The real risk in this category is not a bad platform, but one that looks right until it is no longer sufficient for key use cases. At that point, switching is expensive enough that most teams live with the limitations.
The stakes rise with the power bill. The U.S. Energy Information Administration expects commercial electricity prices to continue climbing through 2026 as data center growth strains the grid. With prices set to keep surging, both unmanaged peak demand and a wrong platform decision will become far more expensive each year.
Yet navigating this high-stakes decision is harder than it looks. This guide provides a framework for narrowing the list: the six criteria that matter, how platforms are priced, the questions that reveal real limitations, and the benchmarks to hold every claim to.
An energy management system is a platform that collects, analyzes, and acts on a building's energy consumption data. It transforms raw meter and sensor data readings into the insights and control needed to reduce costs, manage peak demand, meet compliance requirements, and support use cases such as tenant billing.
The distinction that matters most to a buyer is that simple monitoring tools only show you data. An EMS adds the analytical, reporting, control, and workflow layer that turns data into decisions. This analytical layer is more important than the visual dashboard itself because it provides the insights that appear on the dashboard. Expect real-time consumption monitoring, peak demand management, compliance and benchmarking reporting, measurement and verification (M&V), portfolio analytics, and integration with a building's existing controls.
That integration piece is exactly where the confusion in terminology starts, because an EMS rarely operates alone.
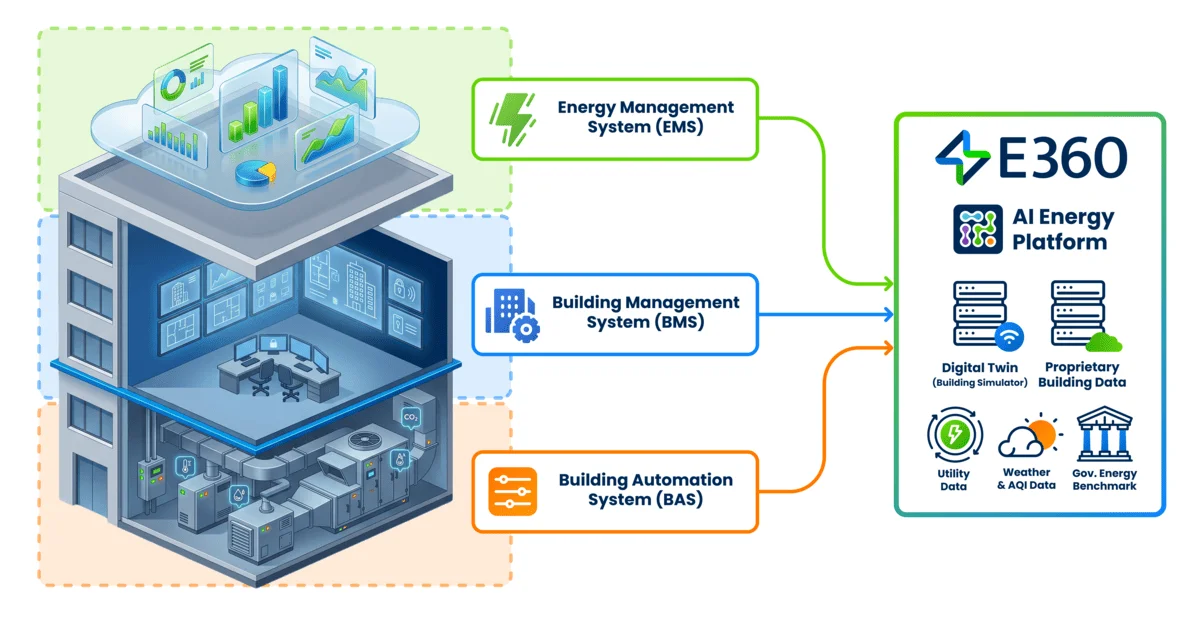
The three terms are used inconsistently, but the functional distinction is straightforward. Here is how they break down:
Do you need more than one? In most cases, yes. An EMS can overlay a BAS or BMS or operate independently when no automation exists. Typically, the missing layer is the one that makes operational data usable for cost reduction, compliance reporting, and demand response participation.
Single-site needs center on granular usage data, controls integration, and fast time-to-value. The portfolio needs to center on granular site data, cross-site benchmarking, standardized reporting across BPS-regulated jurisdictions, and a centralized data architecture to enable comparisons of buildings with different ages, systems, and tenant profiles.
A platform built for one often fails at the other. Decide which problem you are hiring the platform to solve before a vendor walkthrough shapes your expectations. If you manage multiple properties, our portfolio management guide covers cross-site requirements in depth.

Feature lists look identical by the third demo. These six criteria distinguish platforms that hold up in real-world conditions from those that only look good in a sales presentation.
Can the platform integrate with your existing BAS, meters, and utility data without a multi-year IT project? Look for standard protocols such as BACnet and Modbus, as well as open APIs. If proprietary hardware is required to unlock full functionality, the platform likely has a closed ecosystem.
Can the platform handle five buildings the same way it handles fifty? Many platforms visibly degrade beyond single-site depth. Ask for a live demo with a dataset of 20 or more buildings, not a curated example.
Building Performance Standards are now adopted in more than a dozen U.S. jurisdictions, with 40-plus state and local governments committed through the National BPS Coalition. Reporting must align with specific jurisdictional requirements, not generic benchmarking outputs. Since most BPS limits are set in energy use intensity (EUI), measured in energy per square foot per year, the platform must track EUI natively. ENERGY STAR Portfolio Manager compatibility is also table stakes. To see which rules apply where, consultIMT's policy comparison map.
Does the platform provide real-time visibility into peak demand and demand response enrollment? Demand response features that manage consumption based on grid conditions or utility signals are a baseline expectation in 2026, not a premium add-on.
Nearly every platform has a dashboard. The differentiator is whether the analytics surface actionable anomalies, such as a chiller running inefficiently or a misconfigured schedule, rather than charts that confirm what you already know. Forecasting matters because it lets you plan around predicted consumption instead of reacting to last month's bill.
M&V is required if you're looking to participate in demand response, assess the efficiency of retrofits, and demonstrate savings to ownership or utilities. Baselines should follow a recognized protocol. Without rigorous M&V, you cannot verify performance or substantiate ROI; vague answers about baseline methodology are immediately disqualifying.
Most platforms are SaaS subscriptions priced per building, per meter, per data point, or per square foot. In addition to the subscription, budget for additional costs that quotes often understate, such as hardware (submeters and gateways where metering is limited), on-premises fees, systems integration (connecting legacy BAS equipment, usually billed as a service), and implementation and/or onboarding.
Compare vendors by total cost of ownership over the contract term, not the monthly fee. Watch for charges that appear later: data export fees, per-report compliance fees, seat expansion, and annual escalators. A low platform fee paired with expensive everything else is the oldest pricing trick in the category.
Bring this list to every demo. A vendor with nothing to hide answers all ten questions without hesitation; one who deflects or defers to the implementation team shows you what the relationship will look like.
Not every platform that demos well performs well in production. Before you sign anything, watch for these signs:
Every one of these surfaces quickly if you work through the question list above. A vendor who cannot show you the platform running on your own data is asking you to buy on faith.
Vendor sales timelines and actual implementation timelines differ. A mid-sized commercial building typically deploys within three to six months, including energy audits, sensor installation, and configuration. Large multi-building campuses may require six to twelve months, particularly when integrating legacy equipment.
Be skeptical of any single universal savings percentage. The Department of Energy has found that energy management practices, including software-driven monitoring and controls, deliver about 15% in savings across many commercial buildings. These results depend heavily on baseline efficiency and on how actively findings are acted upon.
The Lawrence Berkeley National Laboratory's Smart Energy Analytics Campaign tracked these systems across more than 100 organizations. The analysis found median savings of roughly 3% in year one, rising to 9% with mature use, and a median simple payback of about two years. Separately, Pacific Northwest National Laboratory research sets the ceiling: up to 29% by stacking multiple control measures.
How to read the report data:
An EMS that flags an HVAC schedule running overnight in an empty building only saves money once the schedule is fixed. The platform provides visibility into where the savings occur, but your team delivers the actual savings.

A BMS centralizes control of building systems such as HVAC, lighting, and security. An EMS focuses specifically on energy data: consumption, cost, demand, and compliance. Most buildings pair the two, with the EMS layered on top.
Most platforms are SaaS subscriptions priced per building, per meter, or per square foot, with one-time costs for hardware, integration, and onboarding. Compare vendors using the all-in first-year cost, not just the platform fee.
A single well-metered building can go live in a few weeks to a few months. Small portfolios typically take three to six months, while large portfolios with deep BAS integration will likely take six to twelve months.
DOE research estimates that software-driven energy management delivers about 15% in many commercial buildings. LBNL field data show a median of 3% in year one, rising to roughly 9% with mature use, with a payback of roughly two years. However, actual results depend on how actively your team acts on the platform’s findings.
Usually, yes. A BAS automates equipment but was not designed to analyze costs, verify savings, or generate compliance reports. The EMS translates that operational data into dollars, documentation, and demand management.
The right EMS fits your portfolio size, integration requirements, compliance obligations, and budget, not the one with the longest feature list. Work through the six criteria, hold every vendor to the ten questions, and treat vague answers on M&V, pricing, and data portability as immediately disqualifying.
If you are building a shortlist, E360 is built around the use cases outlined in this guide: integration with existing systems, single-site depth, portfolio visibility, compliance reporting, and demand management. Put it through the same test.
Subscribe to Sanalife Energy's newsletter for top industry insights, trends, and news.


We deliver innovative energy management, demand response, and building automation solutions to enterprise, manufacturing, industrial, healthcare, hospitality, K-12, and higher education sectors across the United States and globally.
©2026 InTech Energy, Inc. DBA Sanalife. All rights reserved. Various trademarks held by their respective owners.