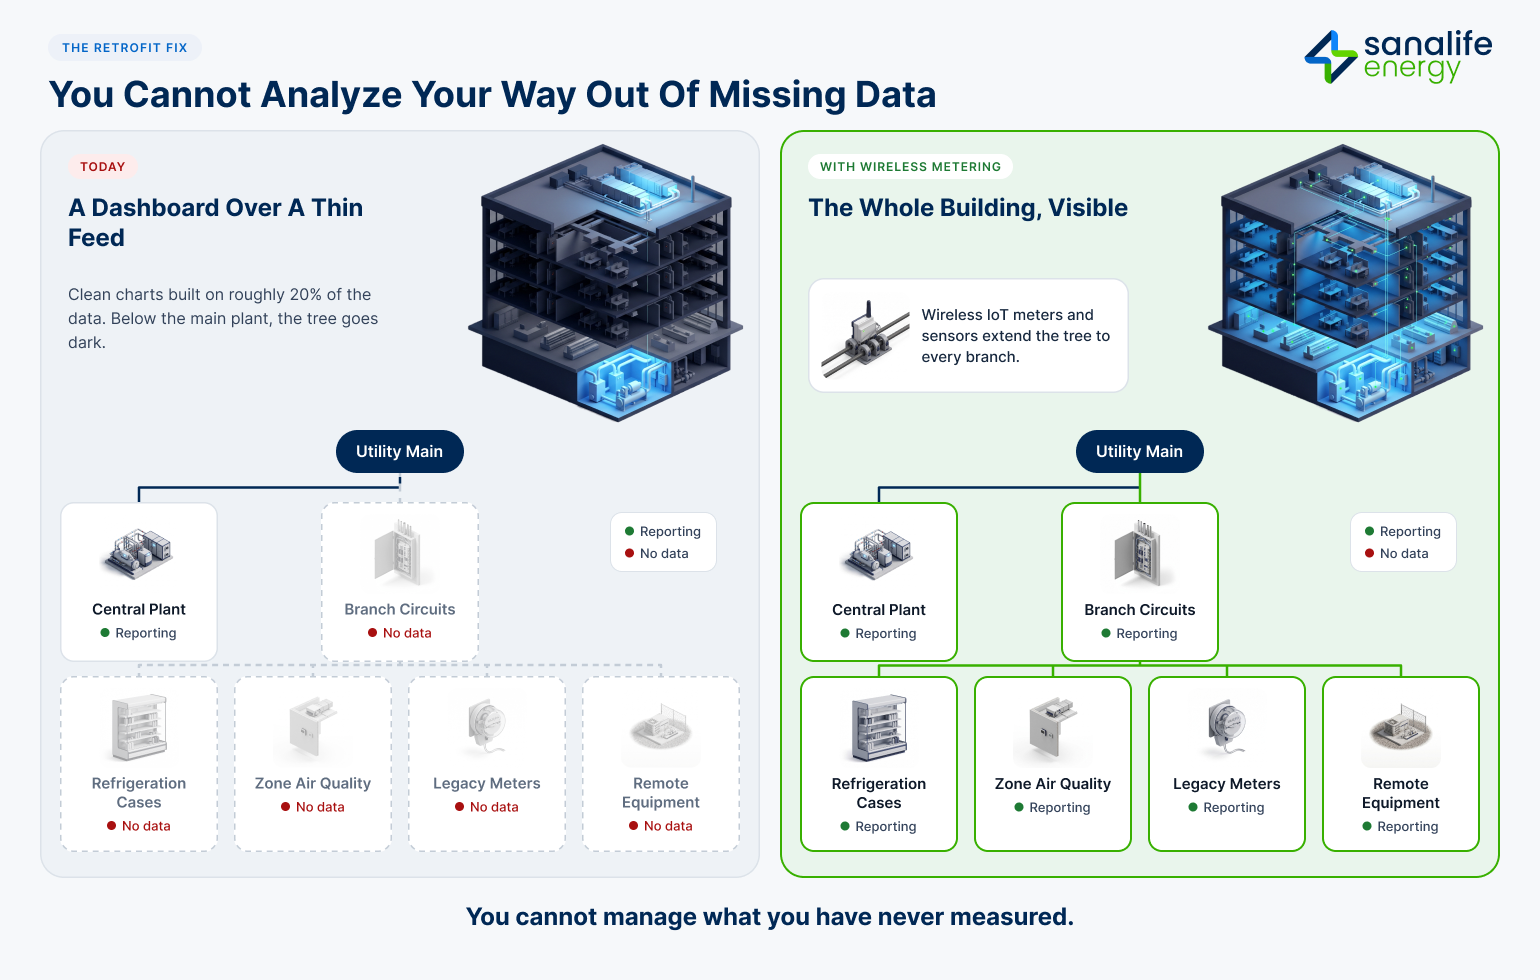
Most commercial buildings monitor only their central plant. Branch circuits, refrigeration cases, zone air quality, and legacy meters report nothing, so waste builds up where no one is looking. Analytics can't fix missing data. Extending the metering tree wirelessly with IoT meters and sensors gives fault detection and energy management the data they need to work.
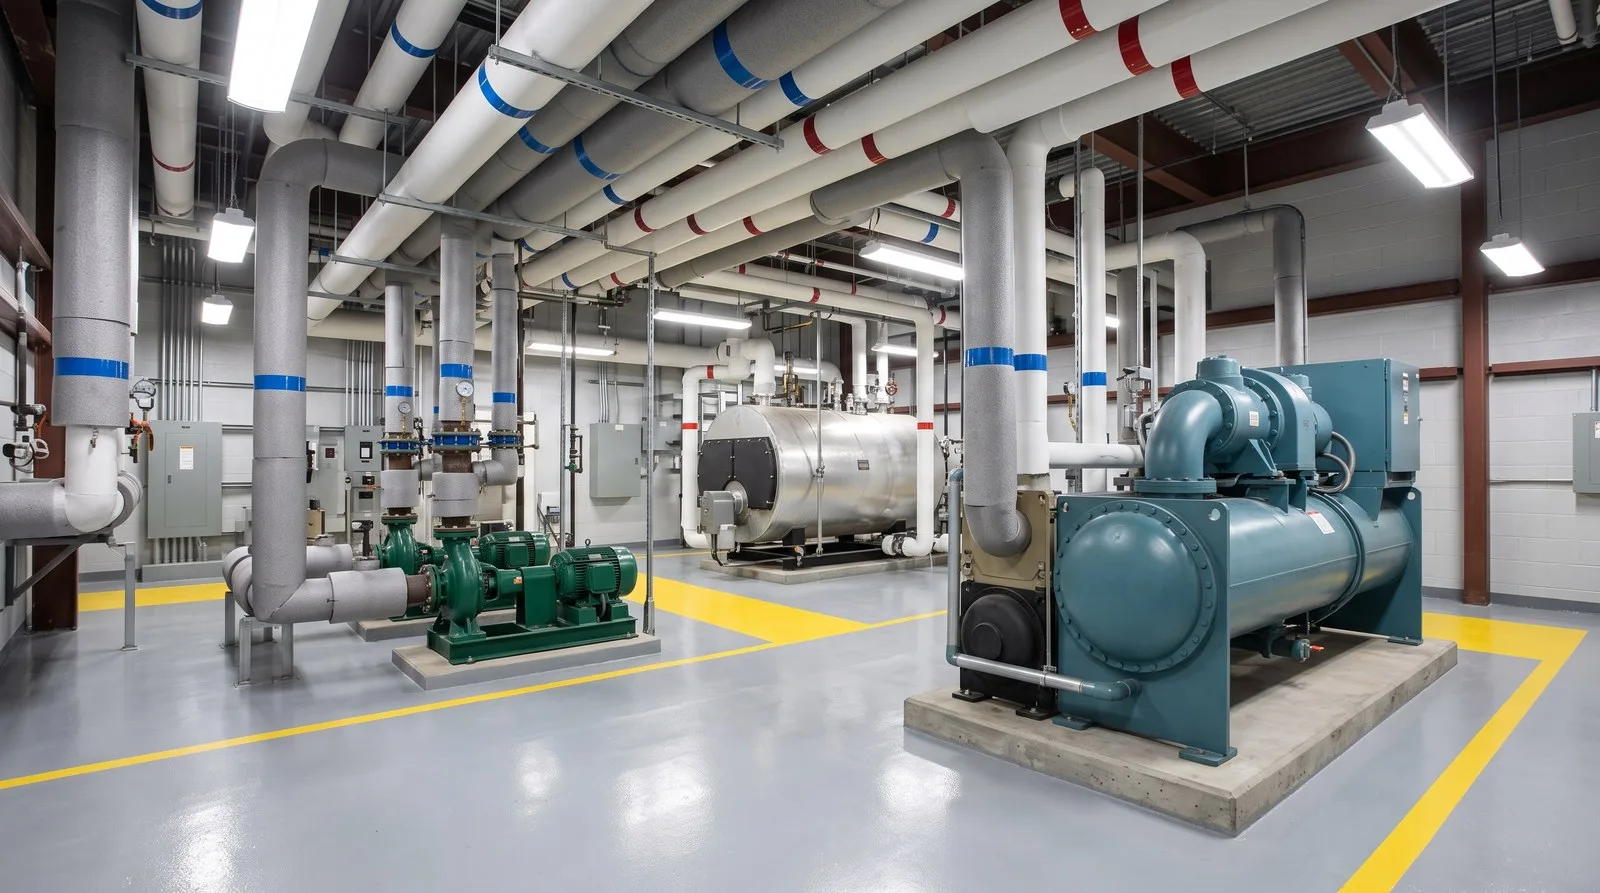
Walk into the mechanical room of almost any commercial building, and the control system is doing what its builders intended: running the big equipment. Air handlers, chillers, boilers. Ask that same system what is happening at the refrigeration cases, the branch circuits feeding a tenant floor, or the air in a specific zone, and it has no answer. Those questions aren't exotic. Nobody wired the system to report on them.
That gap decides whether you actually manage a building or only control it. It is wider than most operators realize.
The building-systems industry has spent years building a shared vocabulary for everything a building can measure. Project Haystack gave professionals a tagging convention, and the Brick schema added a formal ontology of its own. ASHRAE's draft Standard 223P, still in public review as of April 2026, defines a semantic data model for analytics and automation applications in buildings. Together, these efforts give every sensor reading, setpoint, and command a building might expose a shared name.
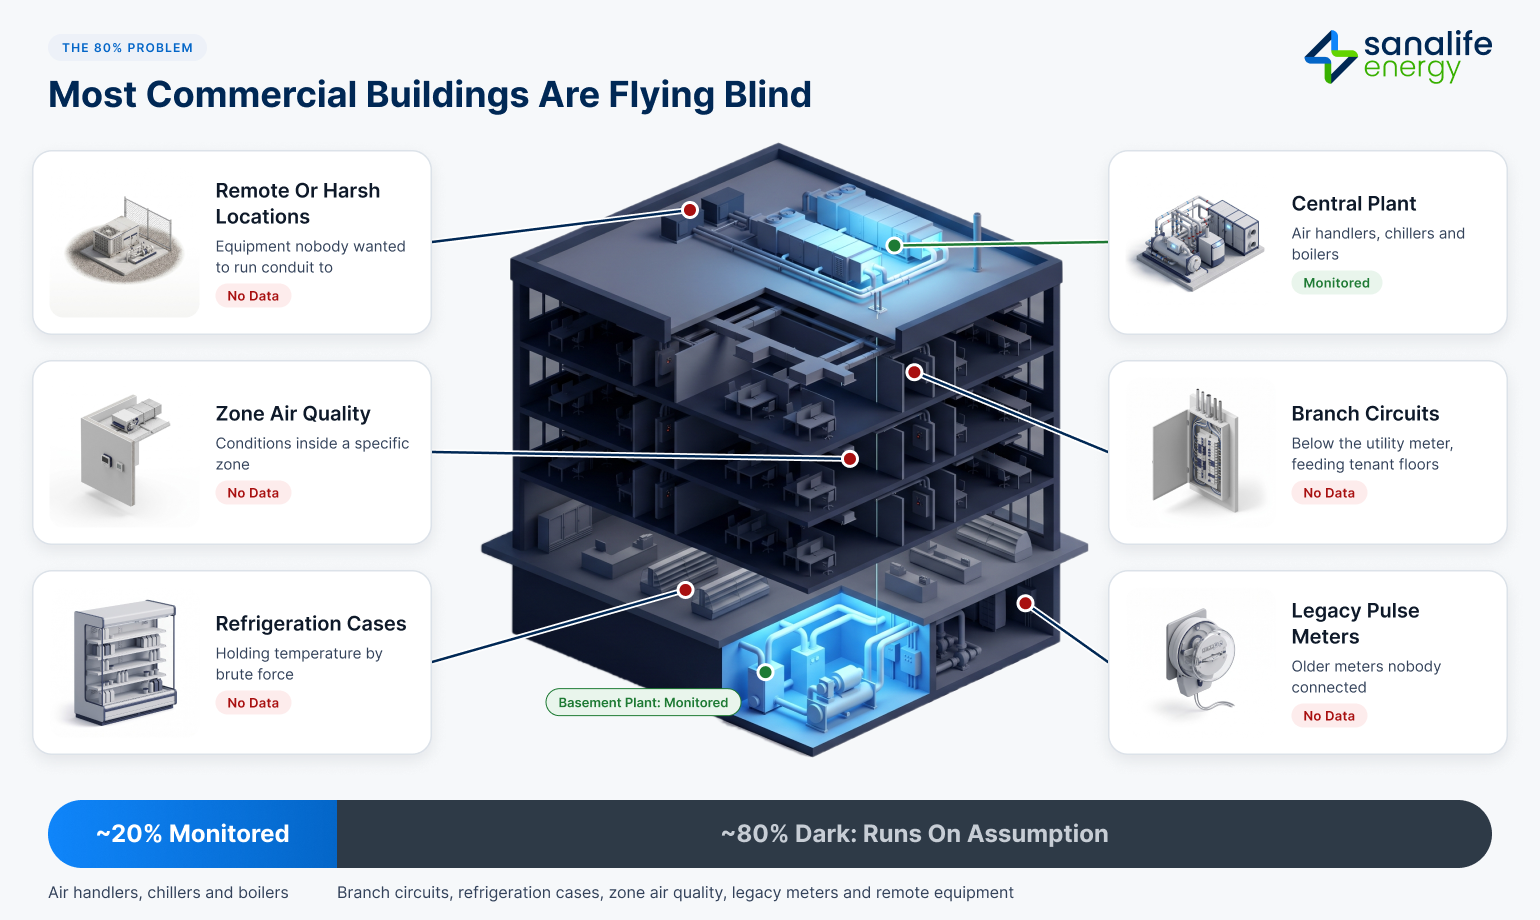
A conventional building automation system (BAS) reaches only a thin slice of that vocabulary. It covers roughly 20% of the equipment it can economically reach, the big central-plant gear, and leaves the rest dark. The points it misses are where money leaks: branch circuits below the utility meter, refrigeration cases, zone-level indoor air quality, legacy pulse meters, and equipment parked in harsh or remote spots where nobody wanted to run conduit.
Call it the 80% problem. The visible fifth of the building gets attention. Everything else runs on assumption.
Equipment you can't see isn't harmless. Its faults go unnoticed.
The U.S. Energy Information Administration reports that commercial buildings account for about 37% of US electricity sales, and the EPA estimates that, on average, 30% of the energy used in commercial buildings is wasted. That waste doesn't come from the chiller everyone is watching. It builds up in the systems no one measures: a refrigeration case holding temperature by brute force, a variable air volume (VAV) box fighting its neighbor, or a circuit pulling more than it should at 2 a.m., when no one is awake to see it.

Faults are the clearest case. Fault detection and diagnostics (FDD) software flags equipment that has drifted out of spec, and it pays: a Lawrence Berkeley National Laboratory survey of 26 organizations across 550 buildings found median energy savings of 8%. But diagnosis works up the chain, from the zone to the VAV to the air handler to the plant, and you can't follow a chain whose lower links were never metered. FDD works only when the data exists. In most buildings, it doesn't.
Here is the part the software-first pitch overlooks: you can't analyze your way out of missing data.
Most of the commercial stock is old. About three-quarters of US commercial buildings were built before 2000, and the median building is 36 years old (EIA CBECS 2018). Those buildings predate today's energy codes and point-level monitoring. Rewiring them floor by floor and circuit by circuit is costly and disruptive for most owners.
So the dark 80% stays dark, and every analytics platform built on that thin feed produces confident charts about the 20% it can see. The dashboard looks complete. The building is flying blind.
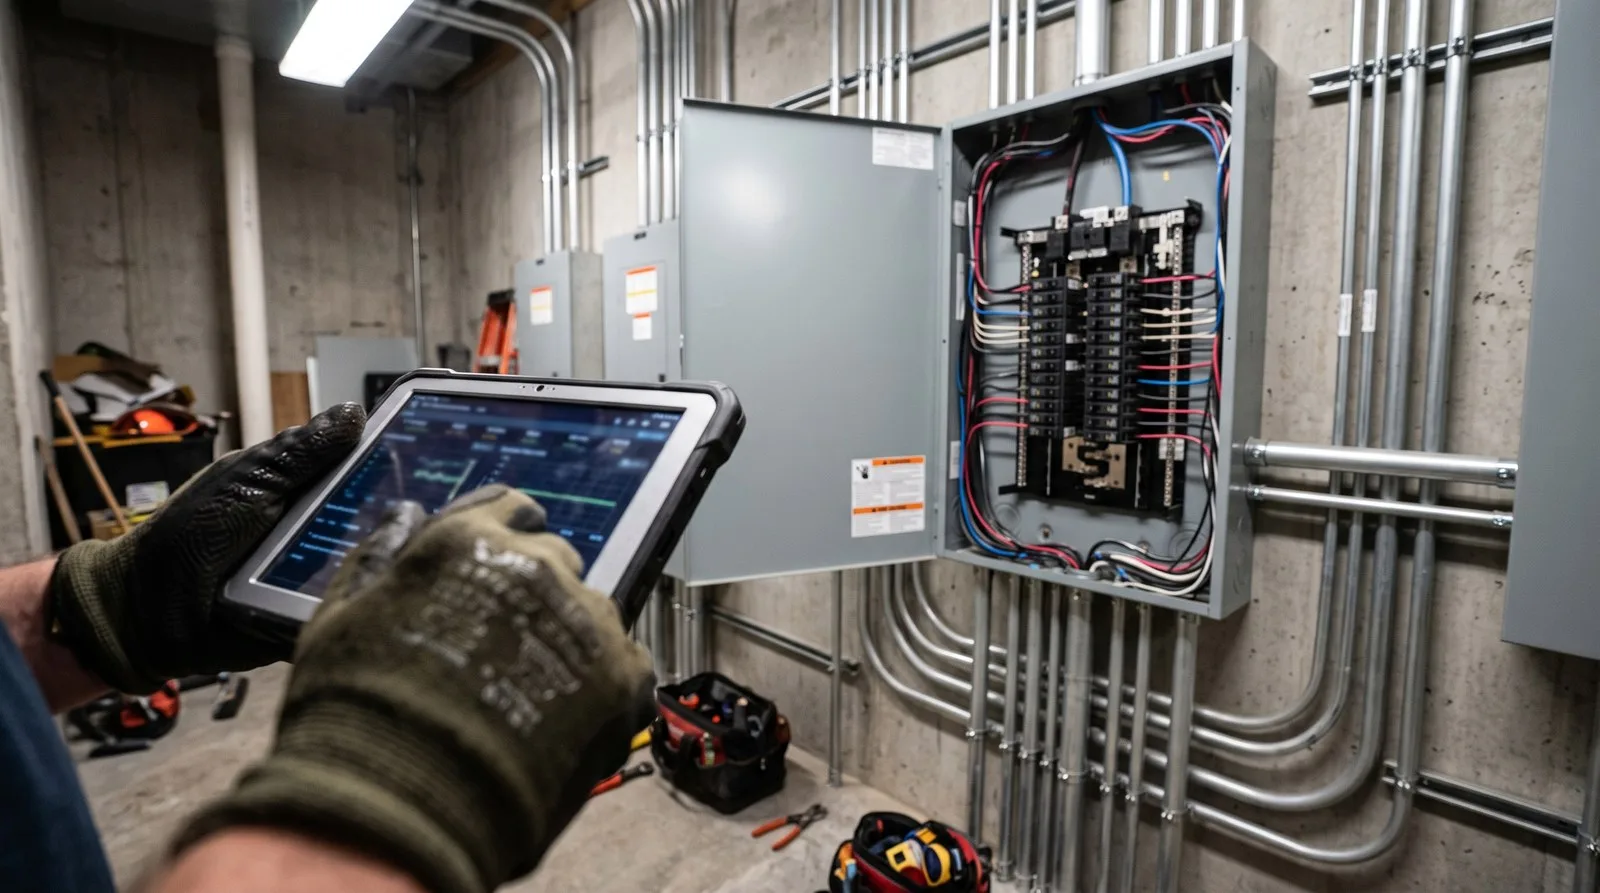
The only path that scales is to instrument the missing points without tearing the building apart. Extend the metering tree wirelessly, with IoT meters and sensors from the utility main down to the branch circuits, covering refrigeration, zone-level air quality, and the legacy meters. That is the work. Analytics are the easy half. The hard, unglamorous half is making those points exist in the first place.
If you manage a portfolio, the key question isn't "which energy platform should I buy?" It is "how much of my building can I actually see, and how much am I guessing?"
Three ways to pressure-test that:
You cannot manage what you have never measured. The only question left is how much of your building you actually can.
The best-managed buildings of the next decade will be the ones that measured the other 80% and pulled every system into one place, not the ones watching a confident dashboard built on 20% of the data.


We deliver innovative energy management, demand response, and building automation solutions to enterprise, manufacturing, industrial, healthcare, hospitality, K-12, and higher education sectors across the United States and globally.
©2026 InTech Energy, Inc. DBA Sanalife Energy. All rights reserved. Various trademarks held by their respective owners.