

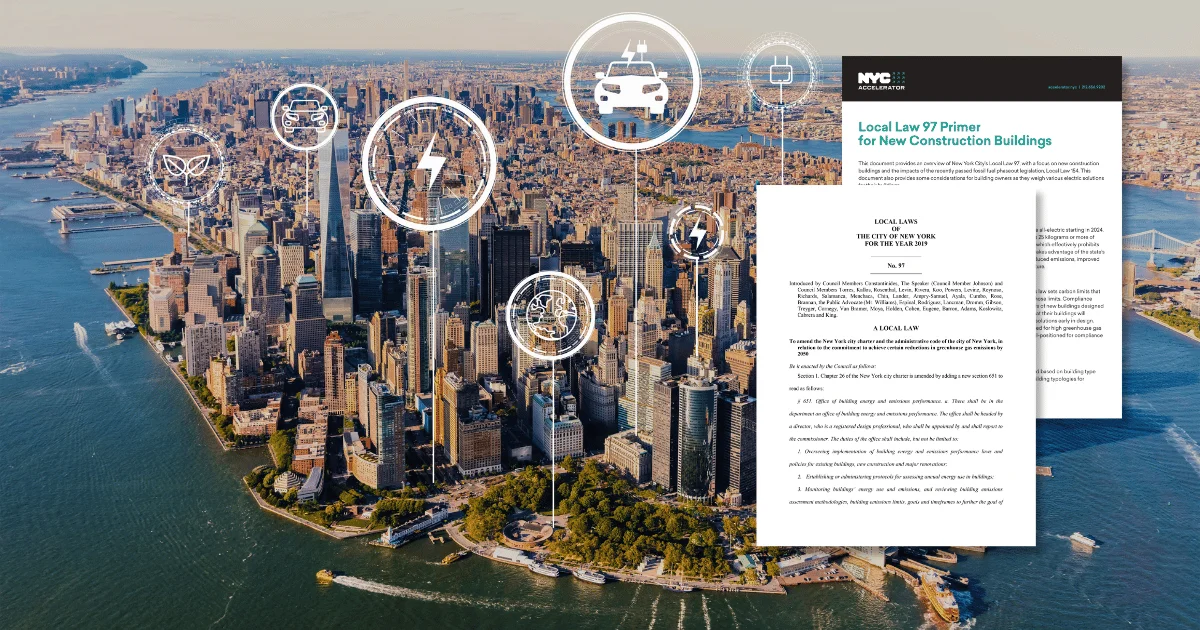
LL97 penalties are $268 per metric ton of CO2e over the cap, assessed every year, with no upper limit. The 2030 limits cut allowable emissions by roughly 40 to 47 percent depending on building type, and 57 percent of covered NYC buildings emit more today than their 2030 cap will allow. A building that passed the 2024 period without changing anything can owe six figures annually starting January 1, 2030.
The first Local Law 97 compliance period was designed to be passable. The second one, starting in 2030, is not. This article covers the money side of that shift: what the local law 97 penalties look like in practice, which buildings carry the most exposure, and the analysis every owner should run before the capital-project window closes.
If you need the law itself explained, requirements, deadlines, covered buildings, and compliance steps, start with our Local Law 97 compliance guide. This piece assumes you know what LL97 is and asks a different question: what does ignoring it cost?
Less than 10 percent of covered buildings exceeded their cap in the first compliance period. That number gets cited as a sign of progress. It is not.
The 2024 to 2029 limits were set to be achievable by most of the existing building stock, because the city needed time to build compliance infrastructure. The 2030 limits are a fundamentally different ask. Urban Green Council's analysis puts roughly 57 percent of covered buildings over their 2030 cap as they operate today, including many that cleared the first period without a single operational change. For a typical office building, the cap drops by roughly 46 percent.
The exposure compounds from there. Unlike a one-time fine, LL97 penalties recur every year a building stays over its cap. And the fix takes longer than the window suggests: HVAC replacements, heat pump installations, and envelope upgrades each run 12 to 36 months from planning to completion. LL97 is expected to drive retrofit projects across tens of thousands of buildings before 2030, which means contractor availability, permit queues, and financing will tighten well before the deadline. Owners who start in 2028 will be competing for the same contractors as every other owner who waited.
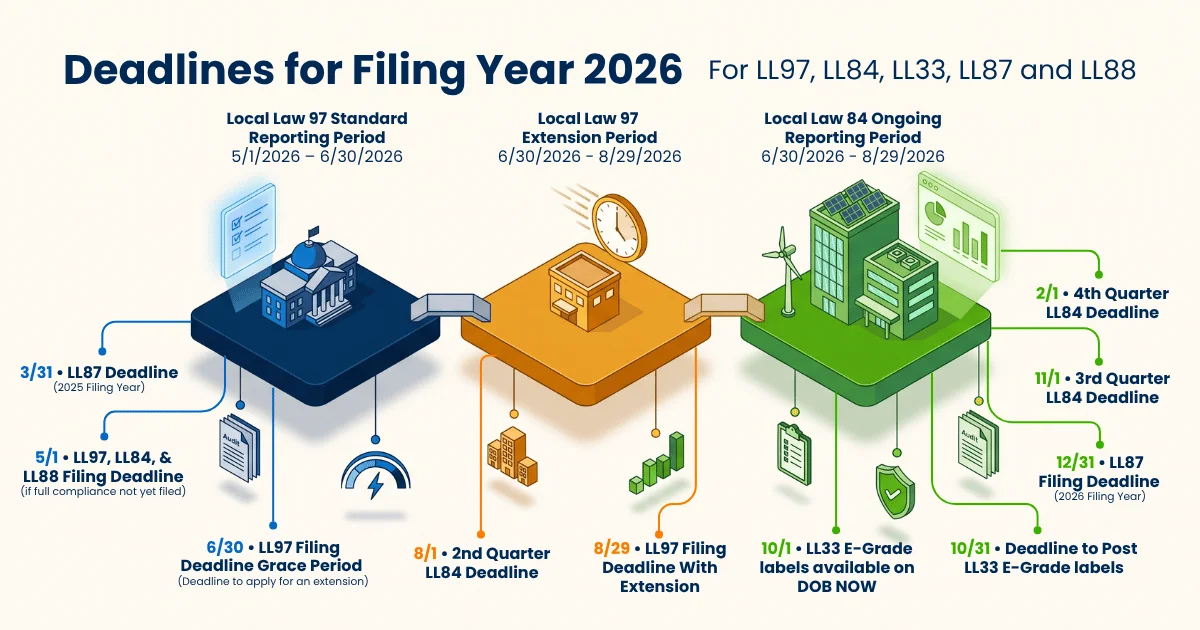
One clarification before the math, since this trips up owners who read the headlines: annual reporting is already mandatory. Since May 1, 2025, covered buildings must file emissions reports certified by a registered design professional through the NYC Department of Buildings BEAM portal. The reporting obligation and the performance penalty are separate exposures, and the second one is about to get much bigger.
The formula is blunt. Buildings that exceed their annual emissions limit face a civil penalty of $268 per metric ton of CO2 equivalent over the cap. There is no upper ceiling, and the penalty is assessed every year the building remains non-compliant.
Applied to a real building: take a 200,000 square foot Class B office building in Manhattan with a 2024-2029 cap of 1,700 metric tons of CO2e. Actual emissions of 1,500 tons sit comfortably under that cap. Under the 2030-2034 limits, the cap for the same building drops to around 900 tons. The building's emissions have not changed, but it is now 600 tons over its limit, and at $268 per ton it owes roughly $160,000. Not once. Every year, until it comes into compliance.
Filing accuracy carries its own liability. Penalties of up to $500,000 apply for knowingly false submissions, which means data quality is a financial exposure independent of whether the building is over its cap. The compliance pathways available to a specific building depend on its classification, which is worth confirming with a qualified energy consultant or legal advisor before committing to a strategy.
Not all buildings carry equal risk heading into 2030. The factors that matter most are heating fuel, building age, and occupancy type, and for most portfolios the highest-risk assets are hiding in plain sight.
Class B office is structurally the largest fine category in Manhattan. Class A trophy buildings largely cleared the first period; they have the capital, institutional ownership, and tenant pressure to have moved early. Class C is often below the 25,000 square foot threshold. Class B, the largest slice of NYC commercial stock by square footage, sits in the middle: large enough to be covered, old enough to run legacy systems, and often without the capital budget or ownership structure to move quickly.
Multifamily accounts for roughly 60 percent of total LL97 square footage, and these buildings burn far more fossil fuel than most commercial properties. Pre-war and pre-1980 buildings with central steam heat and gas cooking face the steepest path. Many have not had a major mechanical upgrade in decades.
The grid dynamic punishes gas heat specifically. The emissions factor assigned to grid electricity drops for the 2030 period, reflecting the grid's decarbonization. All-electric buildings benefit from that shift automatically. The factor for natural gas does not move. Two identical buildings, one electrified and one on gas, face materially different 2030 exposure.
Hospitality carries elevated exposure from continuous HVAC demand; guest comfort keeps systems near full capacity around the clock. Mixed-use buildings get some relief through weighted averaging across occupancy types, which is worth modeling before assuming a worst case.
Unresolved LL97 liability is not just a compliance line, it flows straight into valuation. Penalties reduce net operating income, and reduced NOI reduces asset value. Run the arithmetic: a $200,000 annual penalty on a building trading at a 5 percent cap rate is a $4 million reduction in asset value. Buyers and lenders are already running these numbers against publicly available benchmarking data, and buildings carrying unresolved penalty liability enter every sale process at a disadvantage that grows as 2030 approaches.
The upside runs the same direction. Market studies of green-certified buildings consistently find rent premiums, higher occupancy, and tighter cap rates, and institutional capital is embedding sustainability criteria into underwriting. Compliant buildings borrow on better terms from lenders who face the same pressure from their own investors. Sustainability-minded tenants in the Class A and institutional segments already screen on carbon performance, and a building with a known LL97 liability gets harder to lease to exactly the tenants worth having.
The decision structure is simple. Owners who retrofit before 2030 carry the capital cost once and come out structurally competitive. Owners who absorb penalties instead pay a recurring cost that compounds, face mounting friction in financing and sales, and eventually accept the discount from buyers who priced the liability before making an offer.
The exposure math requires three inputs: your emissions by energy source, your 2030 cap by occupancy type, and the penalty calculated against both. Most owners have not run it. Here is the sequence.
Pull your benchmarking data from ENERGY STAR Portfolio Manager and project 2030 emissions against the tighter caps. If you do not know your current emissions split by source (electricity, natural gas, fuel oil, district steam), that is the first problem to solve: the 2030 calculation applies a different emissions factor to each source, and the electricity factor change alone can meaningfully shift a building's projected exposure.
Not every property in a portfolio carries equal risk. Gas-heavy, pre-1980 multifamily and Class B office should be first in line for detailed assessment. For those buildings, the gap between current emissions and the 2030 cap is likely a capital decision, not an operational adjustment.
For buildings significantly over the 2030 cap, a retrofit often produces a better five-year outcome than recurring penalties, especially once incentives are counted. NYSERDA's FlexTech program cost-shares 50 to 75 percent of a professional energy study that scopes exactly this decision, and NYSERDA's Planning Ahead for Local Law 97 program targets multifamily buildings specifically. Our guide to working with NYSERDA contractors on LL97 and LL88 compliance covers how to put those programs to work.
The May 1 annual filing requires accurate, source-level energy data certified by a registered design professional. Without interval-level metering by source, there is no reliable way to calculate emissions or catch a developing exposure before the deadline. For qualified help, the NYC Accelerator service directory is a free, city-sponsored resource for finding registered design professionals and LL97-focused energy consultants.
The 57% of at-risk buildings includes plenty that passed the first period comfortably. A building 15 percent under its 2024 cap can still be significantly over its 2030 cap. The only way to know is to run the numbers against the new limits.
Platforms like E360 that track consumption by source in real time and map it against LL97's published emissions factors turn projected penalty exposure into a number you watch all year, instead of a surprise that arrives with the May 1 filing.
NYC built the model, and other cities are copying it faster than most portfolio owners realize. At least 13 major U.S. cities have enacted building performance standards, with dozens more committed before the decade ends. Boston's BERDO carries $1,000-per-day penalties. DC's BEPS uses ENERGY STAR scores as its compliance proxy. Seattle's BEPS runs up to $10 per square foot for missed targets. Colorado, Washington, and Maryland have layered state-level laws on top.
For multi-market portfolios, that means overlapping obligations with different deadlines, metrics, and penalty structures. Buildings that stand-up compliance infrastructure once, real-time monitoring, accurate benchmarking, audit-ready reporting, absorb each new requirement as configuration. Buildings that treat each law as a fresh project keep paying to catch up.
$268 per metric ton of CO2 equivalent over the building's annual cap, with no upper ceiling. The penalty recurs every year the building remains over its limit.
January 1, 2030. Caps drop roughly 40 to 47 percent depending on building type, and the stricter limits run through 2034 before tightening again.
Not necessarily. Urban Green Council estimates 57 percent of covered buildings currently emit more than their 2030 cap, including many that passed the first period without operational changes.
Civil penalties of up to $500,000 apply for knowingly false submissions. Reporting accuracy is a separate financial exposure from the performance penalty.
Gas-heated, pre-1980 buildings: Class B office and pre-war multifamily with central steam heat carry the most exposure, because the 2030 electricity emissions factor drops while the natural gas factor does not.
The January 1, 2030 deadline is less than three and a half years out, and for buildings that need capital projects to comply, that timeline is already uncomfortable. The math itself is simple: emissions by source, cap by occupancy type, $268 per excess ton, every year. Owners who run it now get options: incentive programs, contractor availability, and financing on their own schedule. Owners who run it in 2028 get whatever is left.
Subscribe to Sanalife Energy's newsletter for top industry insights, trends, and news.


We deliver innovative energy management, demand response, and building automation solutions to enterprise, manufacturing, industrial, healthcare, hospitality, K-12, and higher education sectors across the United States and globally.
©2026 InTech Energy, Inc. DBA Sanalife. All rights reserved. Various trademarks held by their respective owners.